What Am I seeing on my Portfolio X-Ray on the portal?

Dominic Thomas
March 2026  •  3 min read

What Am I seeing on my Portfolio X-Ray on the portal?

One of the features of our secure portal is the ability to see the live valuations of your investments. These are not ‘held’ on our portal, it is merely a secure reporting tool, loaded with data pulled from the original sources (ie investment platforms, such as Fundment, Nucleus, 7IM, Transact and so on).

The portal pulls through current holdings and allocations, but doesn’t do a particularly good job of showing historic ones. You will see previous valuations, which reflect your actual valuations, but not of a fund that you didn’t have say three years ago but do today due to changes we may have made.

When you review this, you will see a combination of holdings and funds. You have a globally diversified portfolio of assets that are either shares in companies around the world or are a form of loan (debt) that a Government or company have issued. In the latter case (Bonds, Gilts and Cash) you lend your money to Governments and Companies on the agreement that they return it at a set date and in the meantime provide a fixed (agreed) level of interest. It’s more sophisticated than this implies, but essentially that’s what is happening underneath. So you hold lots (7,000-30,000) of securities within funds within your portfolio at a very low cost.

Your portfolio is based in part on your responses to loss (nobody likes it, but we all respond differently). In essence how much panic you feel. Unfortunately, whilst I would prefer emotions were removed from investing, they are a default setting on humans, so the attitude to risk questionnaire helps us assess how anxious you get seeing a large fall in value (or a small one). I am not a robot, but the world stock markets are not the place to develop your character. However, clearly part of good financial planning is to set an appropriate level of risk to generate returns that will beat inflation (and keep your spending power favourable) within the context of our conversations and what the money represents to and for you.

This is given more context by how long you are investing (for most clients it’s the remainder of their lifetime) and the level of average annualised returns that you need to achieve to provide the lifestyle and financial security that you require. These are obviously unique to you and your circumstances. The more held in shares the greater the long-term returns, but the greater the volatility (valuation wobbles).

Then there is possibly some short-term opinion on the state of the global economy or your need for cash (or both) which may also temporarily influence our selection.

The portfolio contents changed recently (to reduce costs and further increase diversification). So these funds are the current position not what you actually held three years ago. Secondly we may have taken some steps (with your agreement) to shore things up based on your short-term requirements for capital or income.

We use data and attempt to extract from this the evidence rationale for making decisions. The mix is appropriate and will include underperformers sometimes.  You may remember me showing you an image that looks rather like a patchwork quilt of top performing assets or markets in each calendar year – a brightly coloured image. It’s very human to attempt to find patterns, but the pattern is that there is no pattern. Here is a recent one by Dimensional, you don’t need to worry about the small print on this, it’s the concept that is important. Ask me if you want a readable copy.

We combine assets to attempt to deliver a particular long-term return. Think of making something with flour, eggs, salt, sugar etc… different quantities and cooking methods provide anything from a pancake to a souffle (and a whole lot besides).

Not all elements will always ‘win’ or even be positive, but they add to the mix to deliver the required result. Think of it a bit like buying umbrellas for rain along with sunglasses and suntan lotion for sunshine. Markets are cyclical and random. In short we don’t look for the needle in the haystack, we buy the haystack.

Sorry for all the metaphors, but I think they work! To assess historic performance, you are better doing this in your platform portfolio (Fundment etc) or leaving it to us and do something less boring instead… (ok you have to be a certain age to get the Why Don’t You? Reference).

Does that make sense?

You may find this a helpful aid in thinking about your investments:

Solomon’s – Investing in Pictures

What Am I seeing on my Portfolio X-Ray on the portal?2026-03-23T16:37:49+00:00

Market turbulence

Dominic Thomas
March 2025  •  3 min read

Market turbulence

If you have followed the news, you will appreciate that global stock markets have been falling sharply over recent weeks. This is in response to the wave of changes and abandonment of normal policy by the new, rather insane US Government.

Your portfolio will have fallen. It will recover, the question is really how much worse will things get and how long before they recover. To which the answer is, “I don’t know” and nobody knows.

I would remind you that we have seen significant falls in market values every year (on average -15% every year at some point), it’s simply that some years you and the media pay more attention.

You can view your portfolio in our secure portal or on the platform portal that we are using for you, typically Fundment, Nucleus, Parmenion or Transact.  However I would caution against doing so regularly as this will merely increase your anxiety, which isn’t good for your health or your financial plan.

Many of us realised that Trump was not someone to be trusted, based on his actions over many years, but despite his very odd decades-long special relationship with Putin, it seems that there are still swathes of Americans who are unable to discern this (even if it smacked them around the face with a kipper). Denial and distortion of facts and reality are in evident supply, unlike truth and justice.

In terms of helpful and reassuring information and our approach to evidence-based investing, JP Morgan produce data about the worst declines in valuation during each calendar year.  Admittedly, this is the FTSE All-Share not the global market, but the principles are exactly the same. It’s a chart that you would have seen before in our client magazine Spotlight.

The chart shows the grey bars as the final return for the calendar year since 1986. It shows that of the 39 completed years, 27 (70%) were positive, 12 (30%) were negative. That means that roughly one year in four is negative. The red dots indicate the worst or deepest decline in each of those years. Every year has a ‘crash’. The average drop is 15% and the median (the middle value when all lined up in order) drop is 12%.

This knowledge hopefully provides some comfort about the reality of ‘drops’ each year, but the message is really – don’t panic, stay in your seat. Admittedly you could say “sell it, get me out” but this will actually realise a loss (make it real rather than notional) and it is unlikely that you will re-invest at a point that is any more favourable, if you do that’s probably luck rather than skill.

We have built your financial plan making allowance for these scenarios. Investments do not grow in straight neat lines; they are erratic.  The greater the proportion you hold in equities (shares), the more volatile, but also the greater the reward over time. Your plan is designed for your entire lifetime and beyond.

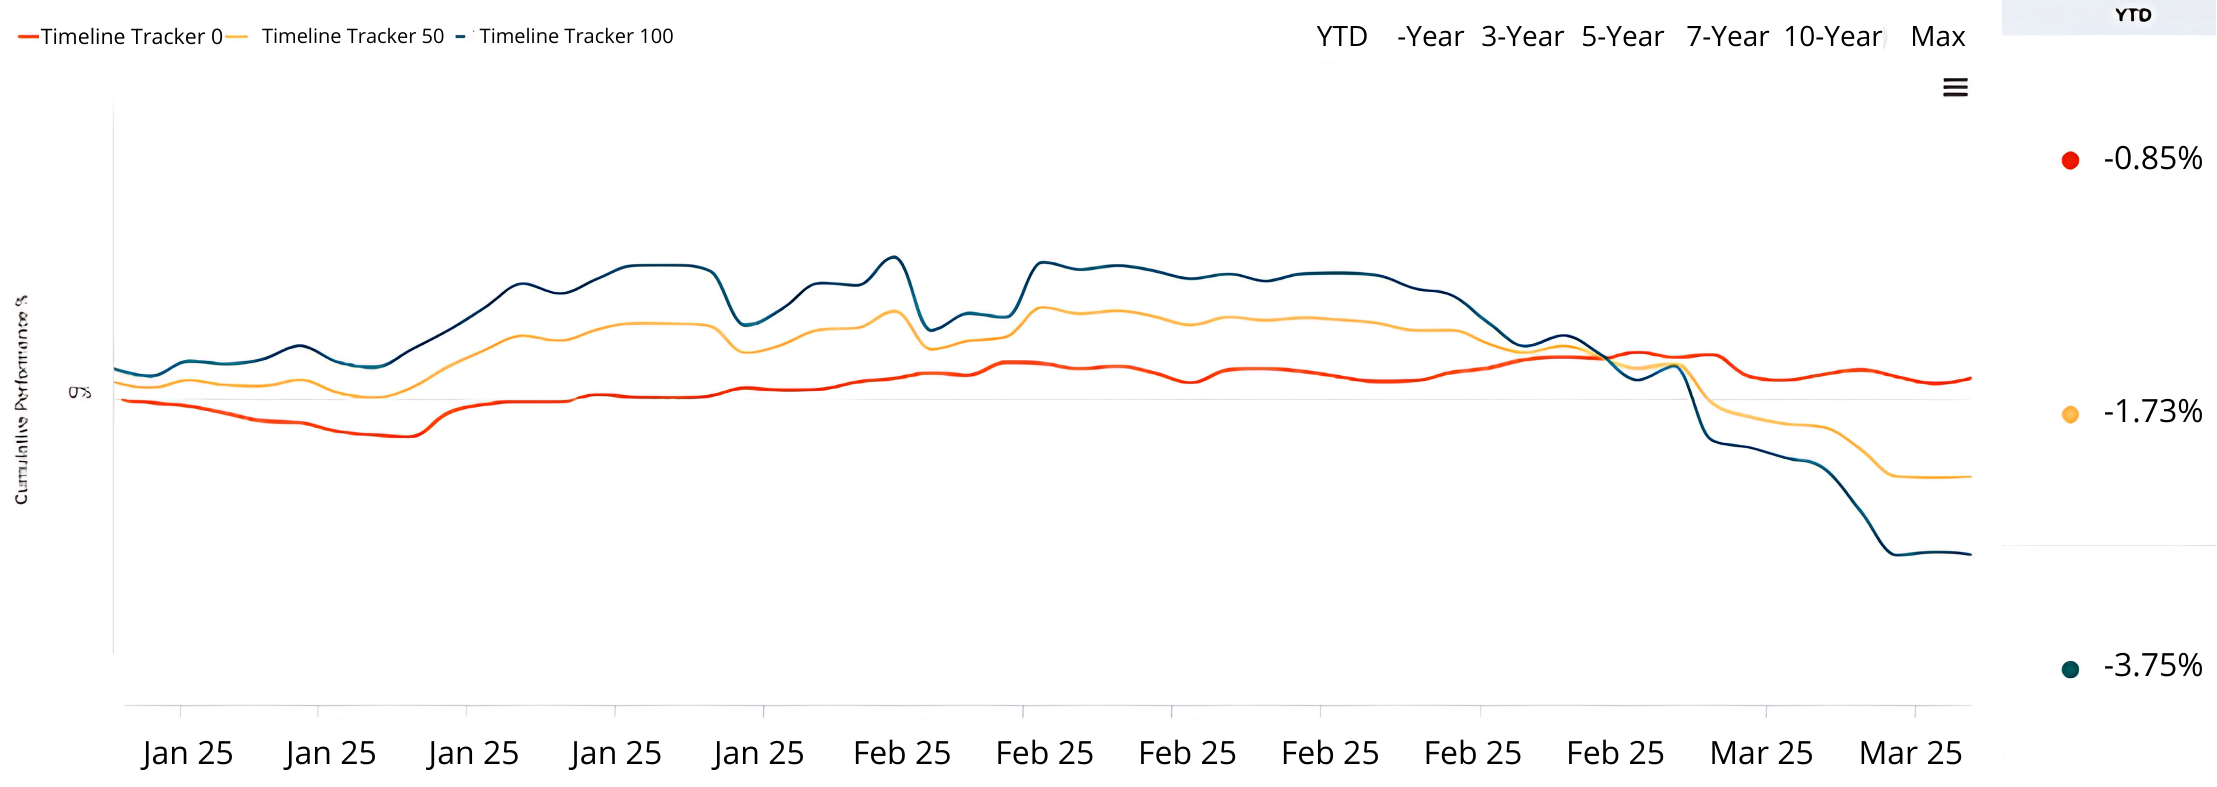
As of now (March 17th 2025), the global equity market is down -3.75% since the start of 2025. Global Bonds are up +0.85% and a 50/50 portfolio is down -1.73%. The numbers in pounds will look considerably worse than this, they always do because you relate to pounds in terms of your income and spending rather than your capital, but it is healthier to consider it in percentage terms. The chart below shows the Year to Date (YTD) figures for Timeline Tracker 100 (green) 50 (yellow) 0 (red).

Looking at a longer term perspective helps provide some context.

None of us like to see portfolios hit heavily, it is unnerving. As I have said, this is currently down to the politics of the US Government, with proposed tariffs and appointing billionaires to act as parodies of Bond villains providing ‘advice’ to the White House. Personally, I hope that he is removed from office as soon as possible, but it is also clear that the Vice President is perhaps even worse, possessing very little understanding of how the world works.

Generally in life we tend to assume that wisdom is correlated with age. At the age of 78 I find no evidence that Trump possesses any. Mr Vance at age 40 certainly hasn’t acquired any yet.

Market turbulence2025-03-20T16:51:04+00:00

ISA ISA, Baby

Daniel Liddicott
April 2024  •  2 min read

ISA ISA, Baby

It came to our attention recently, after a number of queries, that there may be some confusion around when an ISA provides interest and when it provides investment returns. If you are unsure or have been wondering about this yourself, then I hope that this short blog is of interest to you (pun intended, of course).

Cash ISAs produce interest. Stocks & Shares ISAs provide investment returns.

Most Cash ISA providers are able to tell you ‘up front’ what your interest rate will be.  In contrast to this, the growth rate in a Stocks & Shares ISA is not known at the outset – it’s only by looking back at performance that you know what it has been over a period of time.

All ISAs that are held by our clients on the Nucleus or Fundment platforms are Stocks & Shares ISAs and, as the name suggests, the funds held within these are invested in stocks/equity. Therefore, these provide investment returns, unlike their Cash ISA counterparts.

We have also received some queries about the investment term for ISAs. For Stocks & Shares ISAs, it is essentially however long you are willing to leave the funds invested for. And the longer the better! This way, you give your investments time to recover from all of the expected fluctuations in value that the stock market is subject to, providing the prospect for real growth of your ISA funds over the longer term.

Cash ISAs do often come with a particular term attached and, as a general rule, the longer you are willing to leave your money ‘locked away’ in one of these ISAs, the better the interest rate that you will be able to obtain.

As an example, you might opt to place your funds into a Cash ISA with Nationwide for the fixed term of one year, with the agreement that Nationwide will pay you a certain amount of interest over that time period. The interest that you receive on the one-year fixed term is highly likely to be greater than if you were to opt for an ISA that you can dip in and out of as you please without any restrictions.

If you would like to read a more detailed blog on ISAs, you might find this helpful:

What is an ISA?

ISA ISA, Baby2025-01-28T10:04:09+00:00
Go to Top